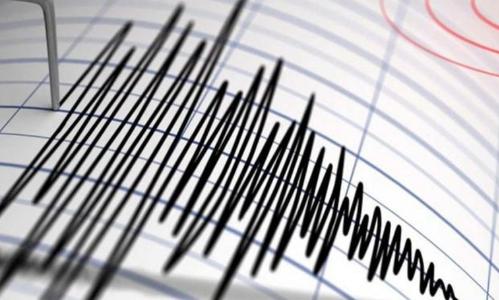
قسم الجيوفيزياء

المزيد ...

حول قسم الجيوفيزياء

شهدت كلية العلوم توسعاً كبيراً في الاقسام في عقدي السبعينات والثمانينات من القرن الماضي ، كان من بينها تأسيس قسم الجيوفيزياء عام 1988م بعد أن كان شعبة تخصصية بقسم علوم الأرض عام 1976م ، ويسعى القسم إلى تطوير برامجه الدراسية الجامعية والعليا من خلال افتتاح القسم الجديد بمعامله المتكاملة.

للقسم تعاون وثيق مع أقسام الاستكشاف بالهيئات و المؤسسات الوطنية المتخصصة كشركات النفط و مركز بحوث النفط و مركز البحوث الصناعية و الهيئة العامة للمياه و غيرها في الاستشارات الفنية و المشاركة في تنفيد بعض الدراسات و برامج التدريب ...

يُنضم القسم العديد من الندوات العلميه والثقافيه خلال الفصل الدراسي , وذلك باستضافة خبراء ليبيين وأجانب في مجلات متعددة منها الاستكشاف الجيوفيزيائى والجيولوجى والهندسه النفطيه.

حقائق حول قسم الجيوفيزياء

نفتخر بما نقدمه للمجتمع والعالم

10

المنشورات العلمية

93

الطلبة

64

الخريجون

البرامج الدراسية

منشورات مختارة

بعض المنشورات التي تم نشرها في قسم الجيوفيزياء

The Role of Remote Sensing in Supporting Urban Planning in Libya a Case Study of Tripoli Area

Abstract Libyan cities have experienced a period of rapid urban expansion in the past decades. Urban growth as an example has been the focus of urban researches for a long time. Due to the complexity of the urban growth process, it’s very difficult to model urban growth using traditional urban models. Recently, urban researches are keen on a new technology, Remote Sensing. Remote Sensing technique was applied in many aspects of life, due to ability of covering and representing the real world around us. In urban research, field researches set up many applications to simulate the urban phenomena such as sprawl process, landuse change trends, landcover...etc. Remote sensing technology helps to extract and organize the data about such phenomenon. In addition to understand their spatial relationships, and provides a powerful means to planners and decision makers for analyzing and information about a place or a phenomenon. This will have great impact on the quality of the decision-making. The study uses Spot 5 images, topographic maps which derived from aerial photographs for the year 1980. The remote sensing image interpretation and change detection to review the urban expansion for the study area in (1980 and 2009).Spot satellite image of 2009 and Landuse maps1980 will be used to derive information on urban land use in the study area. The visual interpretation is used to extract landuse. The mutual use of Remote Sensing (RS) and Geographic Information System (GIS) describes the overall physics changes of the study area. This effort can be considered as an application case in this field (RS-based town planning information system), where this thesis show how that system can be useful of using this technology and supporting the sector by developing a model that can support the process of planning and maintain what remained of the agricultural lands to prevent them from encroachment by the urban growth.
حسين علي أحمد زيدان (2010)
Publisher's website

Applications of Satellite Images and Bouguer Anomaly in Geological Studies of Gabal Asslahat & Surrounded Area

تقع منطقة الدراسة إلى الجنوب الشرقي من مدينة طرابلس وتبعد عنها بمسافة مائة وأربعون كيلو متر تقريباً. منطقة الدراسة عبارة عن مجموعة من الهضاب يتمركز في وسطها جبل الصلاحات المكون من الانسيابات البازلتية والتي تتمركز في وسط منطقة الدراسة. صورة القمر الإصطناعي لاندسات من الفئة السابعة للحزم الثانية والرابعة والسابعة ثم معالجتها وتسجيلها إلى خطوط الطول ودوائر العرض في منطقة الدراسة تمهيداً لتفسيرها للحصول على المعلومات الجيولوجية والجيومورفولوجية والجيولوجيا التركيبية لهده المنطقة هده المعلومات التي استخدمت في نمذجة البيانات الجاذبية التي تغطي منطقة الدراسة.معالجة صورة القمر الاصطناعي تم أجرأها باستخدام تقنيات المعالجة والتي تتمثل في صورة الألوان غير الحقيقية، الفلترة، المط الخطي، المط غير الخطي، تحويل المركبات الأساسية، تحسين الحواف، وغيرها وفي كل مرة تطبق عملية من عمليات المعالجة على الصورة تعرض الصورة المنتجة إلى عمليات التفسير باستخدام العناصر التقنية وعناصر الصورة مباشرةً من شاشة الكمبيوتر وتم في هذا المضمار إنتاج مجموعة من الخرائط (الخريطة الجيولوجية، خريطة الجيولوجية التركيبية وخريطة توزيع التكوينات والوحدات الصخرية المختلفة) الأشكال رقم (and 233،17،18،19،20،21) من خلال خريطة التوزيع المكاني للوحدات الصخرية لمنطقة الدراسة تم انجاز خريطة جيولوجية ذات دقة عالية بالاستفادة من المعلومات الجيولوجية المنشورة في منطقة الدراسةهده الخريطة استخدمت كأساس في عملية النمذجة للبيانات الجاذبية فيما بعد.ومن خلال الزيارات الميدانية المتكررة لمنطقة الدراسة تم اعتماد أربعة عشر نقطة تحكم أرضية Ground Control Point جمعت منها عينات صخرية لقياس الكثافة للتكوينات والوحدات الليثولوجية المختلفة في منطقة الدراسة. والمرحلة الأخيرة من هذه الدراسة هي عرض البيانات الجاذبية على شكل خرائط تدرج لوني يمثل الاختلافات في قيم الجاذبية والتي من خلالها يلاحظ أن أكبر قيم وأقلها للقراءات هي لقيمة الجاذبية كما هو مبين بالشكل رقم . (Figure 4.2.). 6.8 mlgal and -68 mlgaمع ملاحظة وجود بعض الانغلاقات في شمال ووسط وجنوب خريطة البوغير واعتماداً على خريطة شاذة البوغير تم اختيار عدد اثنان بروفيل (خطوط مناسيب ) لإجراء عملية النمذجة في بعدين وروعي في هذا الاختيار أن تمر هذه البر وفيلات بأكبر عدد من الانغلاقات في منطقة الدراسة وباستخدام برنامج (Oasis Montaj)تم معالجة البيانات الجاذبية وفصل الشواذ باستخدام المركبة الثانية Downward continuation , Upward continuation وفي نهاية المطاف تم الحصول على تمثيل للتوزيع الجيولوجي لمختلف الطبقات يحاكي قيما لجاذبية الحقيقية المسجلة في منطقة الدراسة. Abstract Gabal Asslahat located at north central part of Libya comprises the east end for Gabal Nafusa. The rock type in the area is extrusive rocks chiefly olivine basalt and phonolite in both side near to Gharyan BaniWalid area. The age of these igneous rock is mostly of Tertiary age (Eocene) and a part of them may be classified as Quaternary age Industrial Research Center (IRC, 1977). The area around the basalt flows is covered by the upper cretaceous rocks and specially the rocks of cenomanian and Turonian ages which described as dolomatic limestone, marl, shale and gypsum (lower part of Mizdah formation of AL-Hamra Group). The study area comprises a high land of basalt rocks with 968 m maximum elevation above MSL.In this study accurate evaluation of the geological information from the satellite images were performed. Landsat TM7 image and other satellite images were processed and registered to the coordinates of the area using standard techniques. Image stretching, image filtering, image FCC, image ratio, image contrast, image transformation and principle component generation is the main image processing operation will be used during the course of this study.After the image enhancement would completed the study were proceed with image interpretation using the recognition elements and technical elements. Facsimile for each image was generated for all information possibly extracted. A geologic map of the area was compiled from all facsimiles interpreted from various images. The satellite image interpreted (geologic map) shows the accurate information regarding the spatially distribution rock exposures in the area is the final product of the remote sensing operation in this study.Visual evaluation of the Bouguer anomaly gravity map will be accomplished for selecting the geotraverse for the gravity modeling.Two gravity profiles will be used for the 2-D modeling along with the other information from geology and field information.
موسي محمد علي اليونسي (2009)
Publisher's website

النمذجة الجيولوجية للبعد الثالث للمناطق الجافة باستخدام تقنية الاستشعار عن بعد بالتكامل مع الجاذبية

استخدمنا في هذه الأطروحة بيانات الاستشعار عن بعد للقمر الاصطناعي لاندسات للمجس ألخرائطي الموضعي بالتكامل مع بيانات الجاذبية على شكل شاذة بوجير و التي أمكن الحصول على ما يغطي 70% من منطقة الدراسة.بيانات الاستشعار عن بعد على شكل صورة رقمية للقنوات (2. 4. 7) تم معالجتها باستخدام الطرق المختلفة لمعالجة الصورة الرقمية وذلك للحصول على اكبر قدر من المعلومات التي تتعلق بالتخريط الجيولوجي لمنطقة الدراسة في ضوء الخريطة الجيولوجية للمنطقة المعدة من قبل مركز البحوث الصناعية عام 1984. و عند معالجة الصورة الرقمية سواء كانت في شكل قناة واحدة أو صورة ذات ألوان غير حقيقية تم التركيز على تقنيات المعالجة التي تظهر المعالم المستطالة في الصورة و ذلك كونها تمثل التراكيب الجيولوجية المختلفة مثل الحدود بين الوحدات الصخرية و الصدوع و محاور الطيات.و يلاحظ أن منطقة الدراسة منطقة غير آهلة بالسكان مما يجعل المعالم المستطالة الغير طبيعية قليلة بل محدودة جدا متمثلة في طريق في جنوب شرقي منطقة الدراسة أما المعالم الأخرى و التي هي على شكل معالم مستطالة أو خطية فتعرضت للتصفية البصرية حتى تم استبعاد ما لا يوحي بمظهر جيولوجي مثل الاستطالة في الصورة photo trend . ثم عند إجراء أي عملية من عمليات التحسين للصورة الرقمية تم تفسير ما أمكن من الظواهر الجيولوجية المختلفة و التي جمعت مع بعضها البعض مكونة الخريطة الجيولوجية للمنطقة مفسرة من الصورة الرقمية للقمر الاصطناعي.أما البيانات الجاذبية و التي أمكن الحصول على ما يغطي 70% من منطقة الدراسة على شكل شاذة بوجير فقد تم عرضها و وجد إن أعلى قيمة -48.2mGal في هذه البيانات و اقل قيمة -73.5mGal و من هنا نستنتج أن الفارق بين القيمتين لا يمثل شاذة ذات قيمة كبيرة و مهمة في مجال الاستكشاف و هذا القول تدعمه الجيولوجيا في منطقة الدراسة حيث أن معظم الوحدات الصخرية هي من نوع الحجر الجيري و الغطاءات الرملية مع الاختلافات في العمر الجيولوجي.البيانات الجاذبية تم معالجتها ببرنامج Oasis montage و استخدمت الطرق المختلفة لفصل الشواذ الجاذبية و من خلال التركيب الليثولوجي لمختلف الوحدات الصخرية تم استنباط و تقدير قيمة الكثافة النوعية و التي استخدمت في عملية النمذجة باستخدام البرنامج السالف الذكر و أخيرا تم الحصول على الجيولوجيا التحت سطحية لمنطقة الدراسة على طول مقطعين جيولوجيين (A-A') ، (B-B') و اللذان تم اختيارهما بعناية بحيث يمران ما أمكن بالآبار المحفورة بمنطقة الدراسة حتى يتم استخدام السرود البئرية لضمان حدود و سمك الطبقات تحت سطحية من خلال تفسيرها. Abstract In this thesis, was used Remote Sensing Data of the Landsat satellite for sensor Thematic Mapper System with integration of gravity data in the Bouguer anomaly form which enable us to covers 70% of the study area.The Remote Sensing Data, in the digital image form of the Bands 2.4.7, was processed using different methods of digital image processing to obtain much information regarding the geological mapping of the study area in the light of the geological map of the area prepared by the Industrial Research Center in 1984.When the digital image processing, whether in the form of a Single Band or False Color Composite, the focus was on the processing techniques that illustrate linear features in the image since it represents different geological such as boundaries between the unit of the rocks formations and faults, folds and axes.It is noted that the study area is uninhabited, making the Linear features abnormal, few and very limited, represented by the road in the south-east of the study area, The other features which are elongated or linear features form, are exposed to visual filtration, excluding what is not a geological sight such photo trend.When processing any digital imaging enhancement, it has been interpreted as possible of the various geological phenomena which brought together to make up the geological map of the area which is explained in full of the digital image of the artificial satellite.The gravity data, which covers 70% of the study area in the form of Bouguer anomaly map has been presented and found that the maximum value in these data is -48.2 mGal and the minimum value is -73.5 mGal . this difference between the two values might not indicate a great and interesting anomaly of value and mission in the field of exploration and this view is supported by geology in the study area where the most rock units are limestone and sand use with the difference in geological age.The Gravity data was processed by the program Oasis montage and used different methods to separate anomaly of the gravity. Through the lithology composition of various rock units, the value of specific density has been estimated and used in the modeling process using the above mentioned program. Finally, two geological cross-sections (A-A'), (B-B') have been prepared and selected carefully in the way that pass as much as possible through drilled wells in study area to use the available well-logging data in aim to ensure the boundaries and thickness of sub- surface layers through its interpretation.
هشام عبد الله احمد اعواج (2010)
Publisher's website